Your Pest Control Website Score vs Revenue: The Connection
61% of pest control sites score under 20/100. Sites above 60 convert 3-5x more leads. The data connecting website quality to revenue.
Two pest control companies operate in the same city. Same services, similar pricing, roughly equal review counts. One generates 45 leads per month from its website. The other gets seven. The 45-lead company scores 72/100 in our audit. The seven-lead company scores 14/100. The difference isn’t luck, location, or advertising budget. It’s the website.
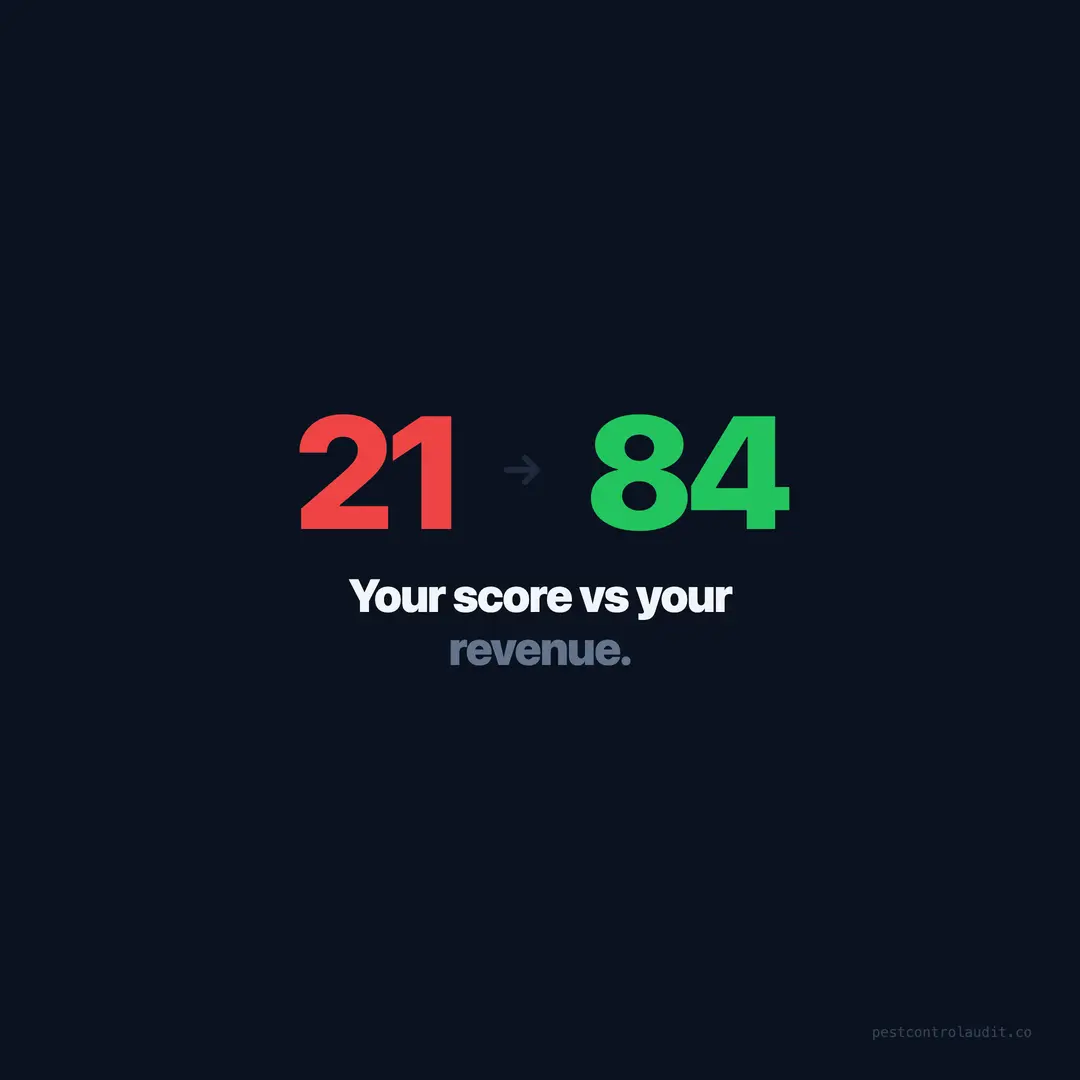
We audited 1,537 pest control websites and found the average score was 21/100, with 61% scoring under 20. The median was 5. The best score in the dataset was 84. These aren’t abstract quality ratings — they directly correlate with how many leads a site generates. Higher-scoring sites have faster load times, complete service pages, working CTAs, proper schema, and mobile-optimized layouts. Lower-scoring sites are missing some or all of these. The revenue gap between them is enormous.
This post connects the dots between audit scores and estimated lead conversion, using data from our full dataset and industry conversion benchmarks.
Low scores mean lost leads — the data is clear
Among the 1,537 sites we audited, 61% scored under 20/100 (Pest Control Audit, 2026). Industry conversion data shows that websites with strong user experience convert at 3.6% while poorly performing sites convert at under 1% (Unbounce, 2025). Applied to pest control — where the average job is $300-500 — a 3x conversion difference on the same traffic means $10,000-$20,000 per month in lost revenue for the low-scoring site.
The score isn’t one thing. It’s a composite of 40+ factors we measure: load speed, mobile responsiveness, click-to-call, service page coverage, schema markup, HTTPS, analytics, forms, CTAs, pricing information, and more. Each gap independently costs conversions. Combined, they compound.
Here’s what the distribution looks like across our dataset:
| Score range | % of sites | Count | Typical lead behavior |
|---|---|---|---|
| 0-10 | 48% | 738 | Near-zero organic leads |
| 11-20 | 13% | 200 | Occasional leads, high bounce |
| 21-40 | 18% | 277 | Moderate leads, conversion issues |
| 41-60 | 12% | 184 | Consistent leads, room to improve |
| 61-84 | 9% | 138 | Strong lead generation |
Nearly half the industry is operating with websites that functionally don’t generate business online. They exist, but they don’t convert.
What a 15/100 site looks like in practice
The typical low-scoring pest control site isn’t broken in one dramatic way. It’s broken in twenty small ways that compound into a terrible user experience. Here’s a composite based on hundreds of sites we’ve reviewed:
Homepage. A stock photo of a house with a “Welcome to [Company Name]” heading. No phone number above the fold. No pricing. No reviews. A generic paragraph about “providing quality pest control services to the [city] area.” The CTA is a “Contact Us” link that opens a page with an email address and a phone number — in text, not clickable.
Service pages. One page titled “Our Services” with a bulleted list: ants, roaches, rodents, termites, mosquitoes, bed bugs. No individual pages. No descriptions of what the service includes. No pricing. A homeowner searching “termite treatment [city]” will never land here because the page doesn’t target that query.
Mobile experience. Desktop layout squeezed onto a phone screen. Tiny text. Horizontal scrolling. The phone number is an image, not a link. Nothing is tappable. 68% of visitors are on mobile (BrightLocal, 2025), and every one of them bounces.
Speed. The page takes 7-12 seconds to load. 53% of mobile users leave after 3 seconds (Google, 2023). Uncompressed images, render-blocking scripts, and no caching. The visitor is gone before the content appears.
This site didn’t cost much to build. It also doesn’t produce much in return. It’s a digital dead end.
What a 65/100 site does differently
The high-scoring sites in our dataset aren’t design masterpieces. They’re well-organized sites that cover the basics thoroughly. The differences from a 15-score site are specific and fixable:
Dedicated service pages. Individual pages for termites, rodents, mosquitoes, bed bugs, ants, and commercial pest control. Each page has unique content, pricing guidance, and a conversion CTA. Google can rank each page for its target keyword.
Click-to-call everywhere. A sticky phone button on mobile. A clickable number in the header and footer. CTAs embedded in the body of every page. Making a phone call should never require more than one tap.
Pricing information. Not exact quotes — ranges. “$150-300 for general pest treatment.” “$200-500 for rodent exclusion.” 35% of sites have no pricing page, and showing any pricing at all puts you ahead of a third of the industry.
Fast load times. Under 3 seconds on mobile. Compressed images, efficient hosting, minimal JavaScript. This alone eliminates the 53% bounce rate that plagues slow sites.
Proper schema markup. LocalBusiness, Service, and BreadcrumbList structured data. 27% of sites have no schema at all. Schema helps Google understand and display your business correctly in search results.
Reviews on the site. Embedded Google reviews, not just a “check us out on Google” link. Visitors who see reviews without leaving the site are more likely to convert.
None of these elements are expensive individually. But combined, they’re the difference between a site that generates seven leads and a site that generates 45.
The revenue math at each score level
Let’s put dollar figures on the score-to-conversion relationship. Assume 500 monthly visitors (reasonable for a pest control company with basic SEO) and an average job value of $400.
| Score | Conv. rate | Leads/mo | Revenue/mo | Annual revenue |
|---|---|---|---|---|
| 10 | 0.4% | 2 | $800 | $9,600 |
| 20 | 0.9% | 4-5 | $1,800 | $21,600 |
| 40 | 1.8% | 9 | $3,600 | $43,200 |
| 60 | 3.2% | 16 | $6,400 | $76,800 |
| 80 | 5.1% | 25-26 | $10,200 | $122,400 |
The difference between a 10-score site and a 60-score site, on the same traffic, is $67,200 per year. That’s not a marketing budget increase. That’s the same 500 visitors converting at different rates because of the website’s quality.
And this is conservative. It doesn’t account for the SEO benefit of a better site (higher rankings = more traffic), the compounding effect of reviews from satisfied customers, or the lifetime value of recurring pest control clients.
The five factors with the largest score impact
Not all 40+ audit factors carry equal weight. Based on our data, these five gaps create the steepest score drops — and fixing them produces the fastest score improvements:
1. Missing service pages (impacts 23-27% of sites). Every service you offer needs its own page. A pest control company without a rodent page or commercial page is invisible for those search queries.
2. No click-to-call (20% of sites). A phone number that’s just text on a page is nearly useless on mobile. Making it clickable is a five-minute fix with measurable conversion impact.
3. No pricing (35% of sites). Even approximate pricing ranges reduce friction. Visitors who see pricing self-qualify — they call knowing what to expect, improving close rates.
4. Slow load speed. There’s no hard percentage, but sites loading over 5 seconds consistently scored in the bottom quartile. Speed optimization is the foundation everything else depends on.
5. No schema markup (27% of sites). Schema doesn’t directly convert visitors, but it helps Google categorize, rank, and display your business correctly. Sites without it are harder for Google to understand.
Each of these can be fixed independently. Start with the cheapest, fastest fix — clickable phone numbers — and work up to service page creation. The five fixes that pay for themselves post covers the specific steps.
Your score isn’t fixed — it’s a starting point
A 14/100 score isn’t a death sentence. It’s a diagnosis. Every point increase represents a specific gap that’s been closed, and every closed gap means fewer lost leads.
The companies at the top of our dataset — the 9% scoring above 60 — didn’t start there. They invested in their websites. Some hired agencies. Some did it themselves over months. What they all share is that they treated their website as a revenue-generating tool, not a checkbox on a business registration list.
If you’re at 14, getting to 30 might take a week of focused work. Getting from 30 to 50 takes professional SEO and content investment. Getting above 60 requires ongoing optimization. But each jump up the curve produces a measurable increase in leads and revenue.
The median score is 5 out of 100. That means half the industry is essentially offline. If you’re reading this, you’re already ahead of most — because you’re aware the gap exists. Now close it.
Find your score at pestcontrolaudit.co/reports/.
Keep reading
Want to know your score?
Drop your URL — full report in 48 hours.
We're on it.
Report in your inbox within 48 hours.