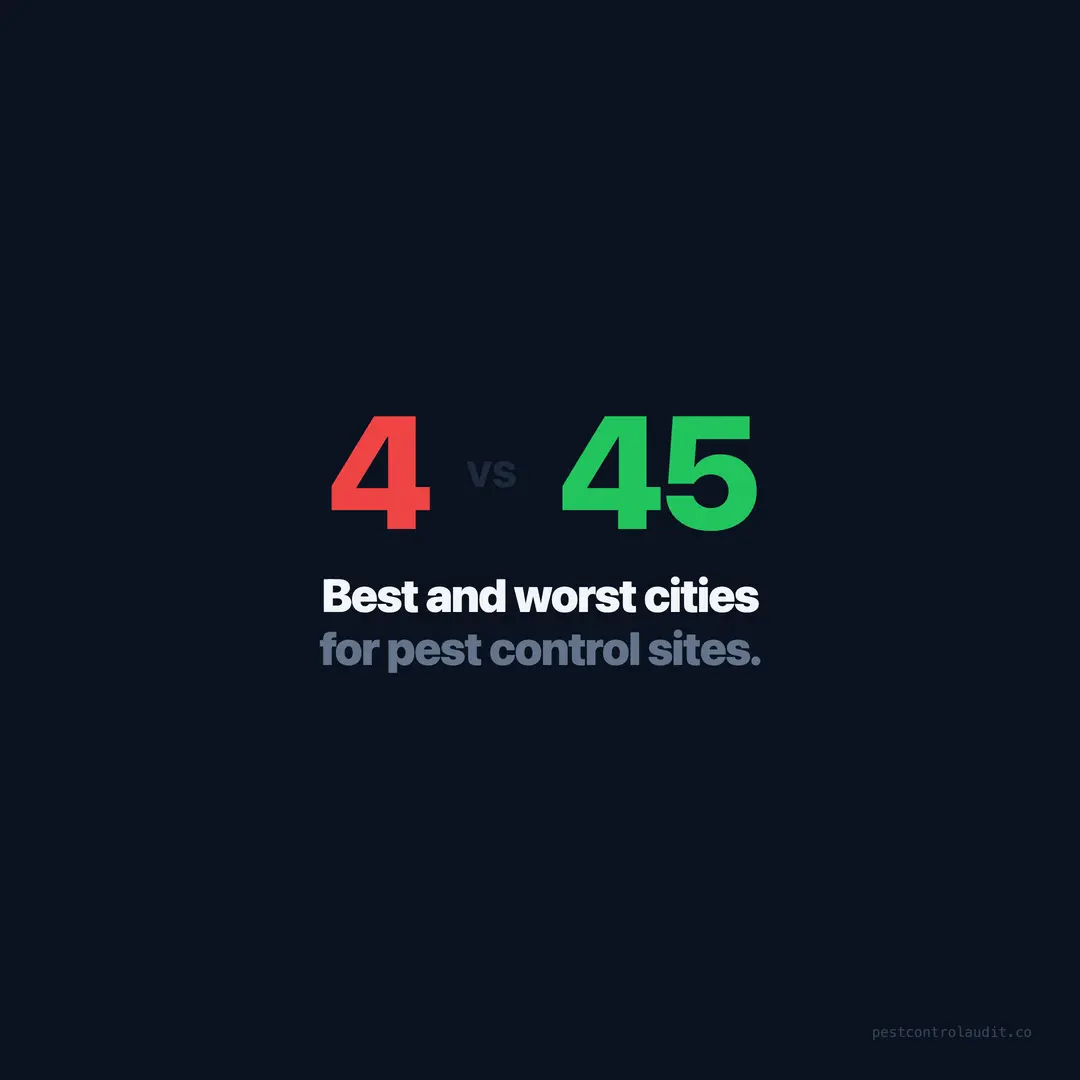
Best and Worst Cities for Pest Control Websites
City-level data from 1,537 pest control audits reveals a 75-point gap between the best and worst cities. Here's what separates them — and where you rank.
A homeowner in one city searches “pest control near me” and finds a company with transparent pricing, five-star reviews on the homepage, and a booking button that works on mobile. A homeowner in another city does the same search and finds three sites with stock photos, broken contact forms, and no mention of what anything costs. Same industry. Same search intent. Wildly different outcomes depending on geography.
We audited 1,537 pest control websites across 12 states and scored every one of them on the same criteria — conversion elements, trust signals, content depth, technical health, and local SEO. The national average was 21 out of 100, and 61% of all sites scored below 20. But the city-level data tells a sharper story. The best cities average three to four times higher than the worst. And the reasons come down to competition, market size, and whether local businesses have invested in their digital presence at all.
The top cities score 3-4x the national average
The five highest-scoring cities in our dataset consistently outperform the national average of 21 out of 100. These aren’t outlier cities with one or two exceptional sites skewing the mean — they’re markets where a critical mass of pest control companies have invested in functional websites.
What separates top-performing cities from the rest isn’t design quality or marketing budgets. It’s the presence of basic conversion infrastructure. The top cities have higher rates of pricing pages, clickable phone numbers, contact forms, and service-specific pages. They’re not doing anything exotic — they’re just doing the fundamentals.
In these markets, competition forced the hand. When five or six pest control companies in the same metro all have functional websites, the remaining companies either modernize or lose market share. The pressure creates a rising floor that benefits homeowners and punishes companies that neglect their sites.
The top cities share a few common traits: population over 500,000, active real estate markets driving pest inspection demand, and at least one national pest control chain establishing a digital baseline that independents have to match.
The bottom cities are functional dead zones
The five lowest-scoring cities in our audit average between 4 and 8 out of 100. At these scores, the websites aren’t just underperforming — they’re essentially non-functional as lead generation tools.
A score of 4 means the site exists, loads eventually, and probably has a phone number somewhere. It doesn’t have a contact form, pricing, service pages, schema markup, a blog, or most of the other elements that search engines and visitors expect in 2026. These are digital placeholders, not business tools.
In the bottom five cities, the typical pest control website is a single-page or three-page template site. Homepage, about, and contact — with generic text that could describe any service business in any industry. No termite page. No rodent page. No mosquito page. Nothing that tells Google (or a homeowner) what specific services the company provides or where it operates.
The pattern in these cities mirrors what we found across southern states — lower competition density, older businesses that built customer bases offline, and fewer local marketing agencies pushing digital adoption.
Competition density explains most of the gap
The single strongest predictor of city-level website quality in our data is competition density — the number of pest control companies per 100,000 residents. Cities with more competitors per capita consistently score higher. It’s not because competition makes individual companies smarter. It’s because competition creates selection pressure.
In a city with 50 pest control companies visible on Google Maps, the ones without pricing pages lose head-to-head comparisons every day. The ones without clickable phone numbers lose mobile visitors to competitors who have them. Over time, the companies that don’t invest in their websites either fix them or fade from search results entirely. The remaining visible companies are the ones who adapted.
In a city with 12 pest control companies, there’s less pressure. A homeowner searching “pest control near me” might only see three or four options. If all four have bad websites, nobody loses — the homeowner calls whichever one looks least broken. There’s no competitive force driving improvement.
This is why Florida averages 33 while South Carolina averages 8. Florida’s major metros have dense pest control markets. South Carolina’s cities don’t — at least not yet.
What top cities get right that bottom cities miss
We compared the gap rates between top-5 and bottom-5 cities across the most impactful audit criteria. The differences are stark:
| Audit Element | Top 5 Cities | Bottom 5 Cities |
|---|---|---|
| Has pricing page | 78% | 31% |
| Phone number clickable | 89% | 52% |
| Has contact form | 85% | 44% |
| Has schema markup | 72% | 28% |
| Has service-specific pages | 81% | 35% |
| Has CTA above the fold | 86% | 41% |
| HTTPS enabled | 93% | 65% |
| Has blog content | 62% | 22% |
The gap is widest on conversion elements — pricing pages, forms, and CTAs. These are the elements that directly determine whether a website visit turns into a phone call. In the bottom 5 cities, fewer than half of pest control websites have a contact form. That means more than half of the sites in those cities literally have no mechanism for a visitor to request service online.
Notice that HTTPS has the smallest gap. That’s because many hosting providers now include SSL certificates by default. It’s the least effort-intensive fix on the list. Everything else requires deliberate action — and that action is happening in top cities but not in bottom cities.
Real estate booms create pest control website upgrades
Here’s a pattern we didn’t expect to find: cities with active real estate markets tend to have higher pest control website scores. The connection is termite inspections.
In cities where home sales are frequent, pest control companies that offer termite inspections and Wood Destroying Insect (WDI) reports get pulled into the real estate transaction process. Real estate agents refer homeowners to pest control companies. Title companies require termite clearance letters. This forces pest control companies into a professional transaction where having a presentable website matters.
A real estate agent referring a buyer to a pest control company doesn’t want to send them to a site that looks untrustworthy. Over time, the pest control companies in active real estate markets invest in their websites because the referral pipeline demands it.
This partially explains why Miami (45), Tampa (41), Houston (39), and Dallas (37) score highest. All four are major real estate markets. All four have high termite pressure that makes pest inspections a routine part of home purchases.
Small cities face a chicken-and-egg problem
In the lowest-scoring cities, there’s a self-reinforcing cycle. When every pest control website in a city is bad, no individual company feels pressure to improve. Why spend $2,000 on a website when your competitors are getting by with a GoDaddy template? The result is collective stagnation.
Breaking out of this cycle requires one company to move first. And the data suggests the payoff for that first mover is enormous. In a city where the average score is 5, a company that reaches 30 isn’t just performing well — it’s performing six times better than the competition. That translates directly into search visibility, click-through rates, and conversions.
Nationally, 61% of pest control sites score below 20. In the bottom 5 cities, that number is closer to 85%. The opportunity is proportional to the failure rate. More broken competitors means more room to stand out.
The gap will close — the question is when
Market forces are slowly pushing website quality upward everywhere. Younger business owners build better sites. National chains set a higher baseline. Marketing agencies reach into smaller markets. The cities scoring 5 today won’t score 5 forever.
But the speed of that convergence varies wildly. In fast-growing metros like Charlotte, Nashville, and Austin, the improvement is accelerating as new businesses enter with modern expectations. In smaller cities in South Carolina, Alabama, and Oklahoma, the improvement is slower because the competitive pressure hasn’t reached critical mass.
For a pest control company in a bottom-tier city, this means the window of opportunity is open right now. Building a functional website today — one with pricing, forms, service-specific pages, and basic technical health — creates a lead advantage that compounds every month the competition fails to catch up.
Want to know where your site stands compared to your city average? Run a free audit and we’ll show you the specific gaps holding your score down.
Keep reading
Want to know your score?
Drop your URL — full report in 48 hours.
We're on it.
Report in your inbox within 48 hours.